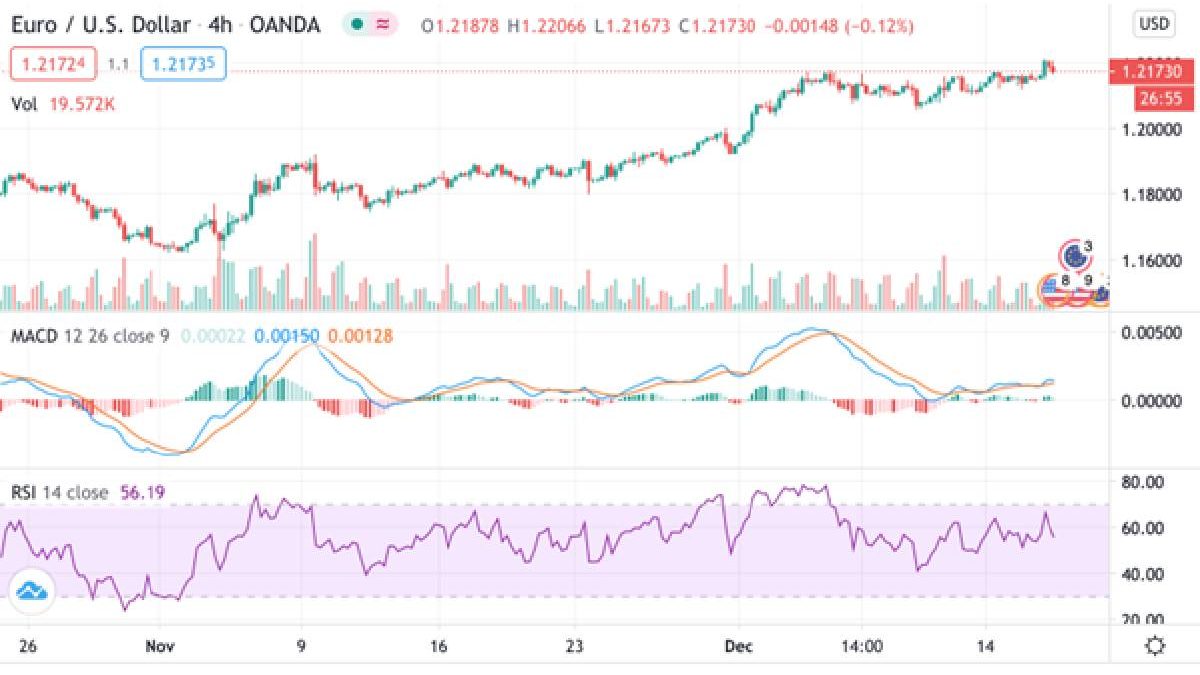
MACD crypto is a technical indicator that measures the strength, direction and momentum of a crypto price. It is a popular technical indicator among traders and can be used as part of a trading strategy.
The MACD crypto indicator can be a great tool for identifying short-term trades and can help you avoid market reversals. It is also an excellent indicator for evaluating the strength of a trend.
When the MACD line crosses over the signal line, it indicates a bullish trend. On the other hand, when it crosses below the signal line, it shows a bearish trend.
Crossovers can be very important in a trading strategy, as they are often the first sign of a trend reversal. They are not always reliable, however, and should be checked against other indicators before taking a trade.
Centerline crossovers and signal line crossovers are the most obvious MACD trading signals, but it is also important to consider divergences. For example, if a cryptocurrency’s price makes a higher high while the MACD creates a lower high, that is considered a bearish divergence. This can indicate weakness on the buying side of the market, a potential reversal and a sale opportunity.
In addition to the MACD line and the signal line, a histogram is included in the MACD cryptocurrency indicator. The length of the histogram bars can determine whether the trend is bullish or bearish.
Histogram divergence
The histogram of the MACD crypto indicator reveals how much of a change in momentum has occurred in the previous bar or interval (day). The histogram will show a higher percentage of long bars when the MACD is above the signal line, and a lower percentage of short bars when the MACD is below the signal line.
MACD histogram divergence can also be a sign of overbought and oversold conditions. If the MACD histogram is above the signal line, it means that bullish momentum is strong and prices will likely rise. On the other hand, if the MACD histogram is below the signal line, it means that bearish momentum is strong and prices will likely fall.
The MACD can be a powerful tool for assessing market conditions, but it is best used in combination with other indicators to provide a more accurate picture of the trend. It is especially useful during bullish markets, where crossovers and divergences tend to occur frequently. In a range-bound market, however, the MACD can become less effective as the trends weaken. This is why many traders recommend combining the MACD with other indicators like the RSI to identify overbought and oversold conditions.

