Table of Contents
Definition Visual Analysis
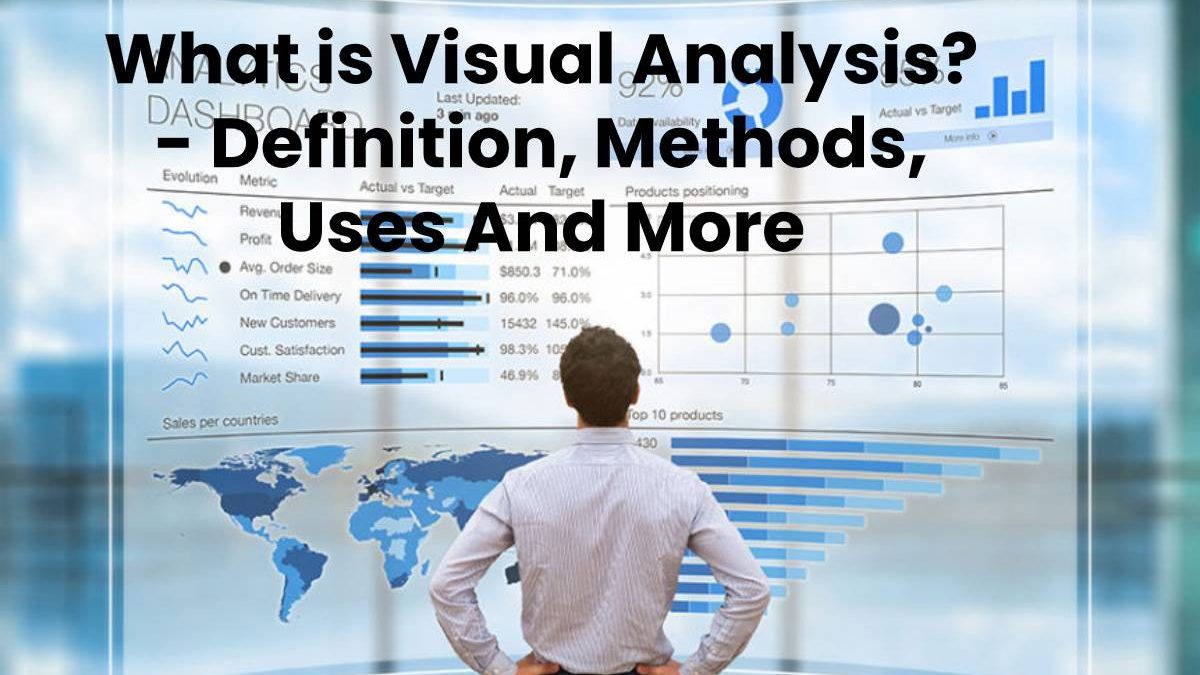
The term Visual Analysis, generally used in issues related to BI and Big Data is the science of rational analysis with the support of a visual and interactive interface. That is the analysis of data, through platforms such as Tableau and Power BI, based on the results of a previously established process or strategy.
Visual Analysis consists of a design inspection in which psychologists and experts examine the web interface to see if it suits the fulfillment of the site’s objectives:
- Efficient use of color (color schemes)
- Structure (adequate arrangement of information blocks)
- Texts and fonts
- Navigation mechanisms (interface)
- Information Density Value (degree of information saturation)
- Proper use of images and animations
- Flexibility, compatibility, and accessibility
- Simplicity and adaptation to the message
The process to generate a good AV
Its process combines automatic and visual analysis methods that establish a human interaction to understand the origin of your data.
The first step is to preprocess and transform the data to create different exploration representations.
This preprocess refers to:
- Data cleaning
- Standardization
- Grouping and integration of heterogeneous data sources.
The second step is to apply an analysis method, either automatically or visually:
Automatic methods of analysis
We can use data mining methods to create models from the original data. Once a model gets created, we must evaluate and improve the models, which we can do better if we interact with the data.
Visual analysis methods
Visual analysis methods allow interacting with automatic methods by modifying the parameters or selecting other analysis algorithms.
By using the visual method, we can improve the preliminary results. We can detect errors before and can obtain 100% better results.
Why use it now?
Thanks to the internet, billions of data are produced today, and the ability to collect and store them is much more than our ability to analyze them. That is why different platforms have been created that help us understand, process, and use them in our favor.
It can also be used in areas such as business, marketing, government, culture, sports, science, and many others, as the world is full of devices that feed the infinite source of data around us.
In summary, the visual analysis process can help us create better ways to communicate, solve a problem, generate better strategies, get to know the user better, keep up with market trends, and an adequate understanding of the results we can obtain from Our work processes.

